EECG_BASELINE_1CH_10S_FS2400HZ.csv
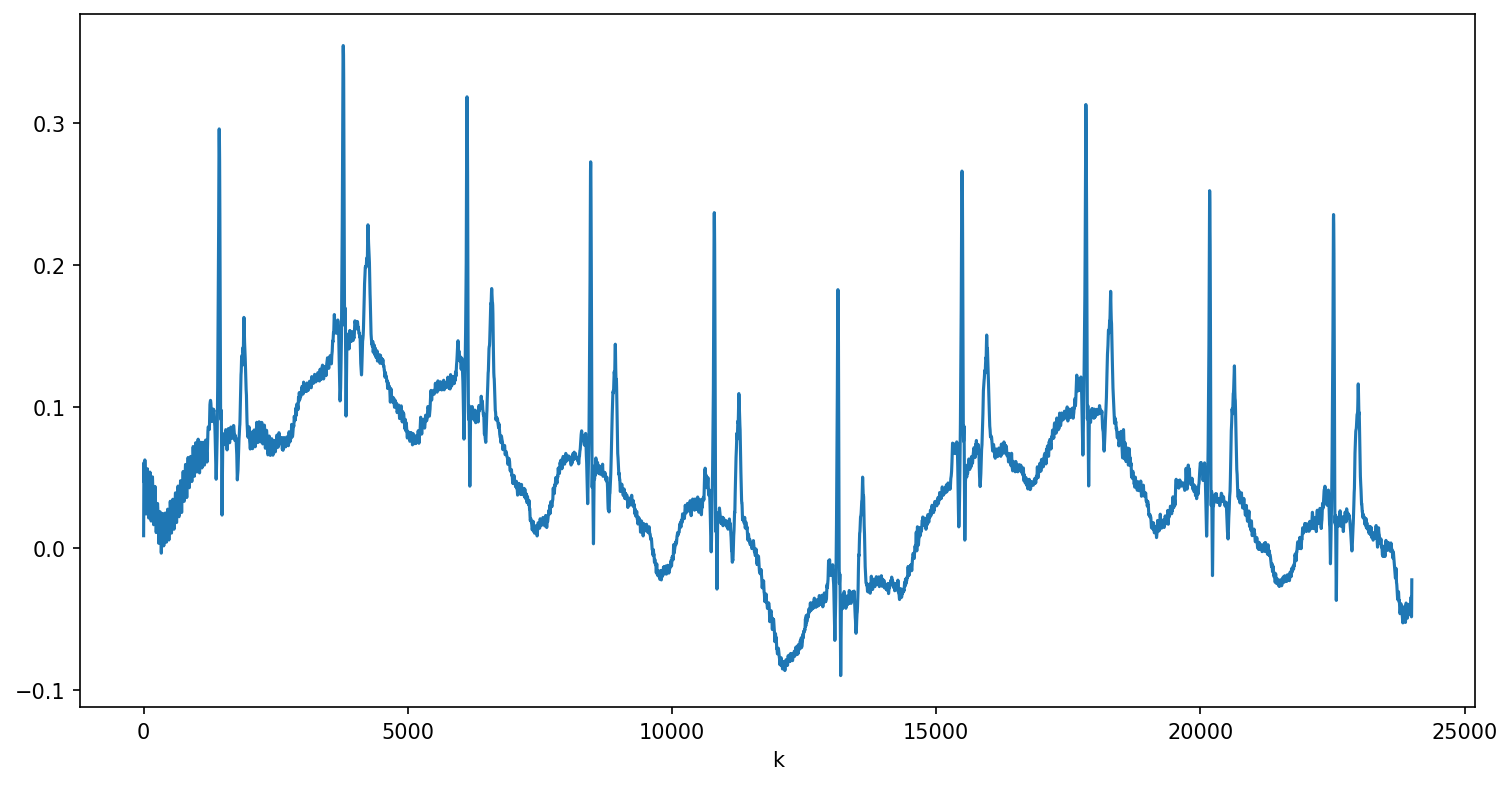
- Esophageal ECG Signal (not filtered)
- 1 channel
- 10 seconds
- Sampling rate: 2400Hz
Plot
Code
"""
EECG_BASELINE_1CH_10S_FS2400HZ.csv
==================================

* Esophageal ECG Signal (not filtered)
* 1 channel
* 10 seconds
* Sampling rate: 2400Hz

"""
from lmlib.utils import load_lib_csv
import matplotlib.pyplot as plt

y = load_lib_csv('EECG_BASELINE_1CH_10S_FS2400HZ.csv')

plt.figure(figsize=(12, 6))
plt.plot(y)
plt.xlabel('k')
plt.show()