lmlib.utils.generator
Functions:
-
gen_sine–Generates multiple sinusoidal signals and adds them to one
-
gen_exp–Exponentially decaying signal generator
-
gen_rect–Rectangular (pulse wave) signal generator
-
gen_saw–Sawtooth signal generator
-
gen_tri–Triangular signal generator
-
gen_pulse–Pulse signal generator
-
gen_steps–Step signal generator
-
gen_slopes–Slopes signal generator
-
gen_wgn–White Gaussian noise signal generator
-
gen_rand_walk–Random walk generator
-
gen_rand_pulse–Random pulse signal generator
-
gen_conv–Convolves two signals. The output signal shape (number of channels and signal length) is preserved from the
basesignal. -
load_data–Loads a single channel signal from the signal catalog, see biosignals_catalog.
-
load_data_mc–Loads a multi-channel signal from the signal catalog, see biosignals_catalog.
-
k_period_to_omega–Converts sample base period (samples per cycle) to the normalized frequency
-
load_csv–loads csv data as a single-channel data shape
-
load_csv_mc–loads csv data as a multi-channel data shape
-
load_lib_csv–loads a library-internal csv data file from the signal catalog as a single-channel data shape
-
load_lib_csv_mc–loads a library-internal csv data file from the signal catalog as a multi-channel data shape
Functions
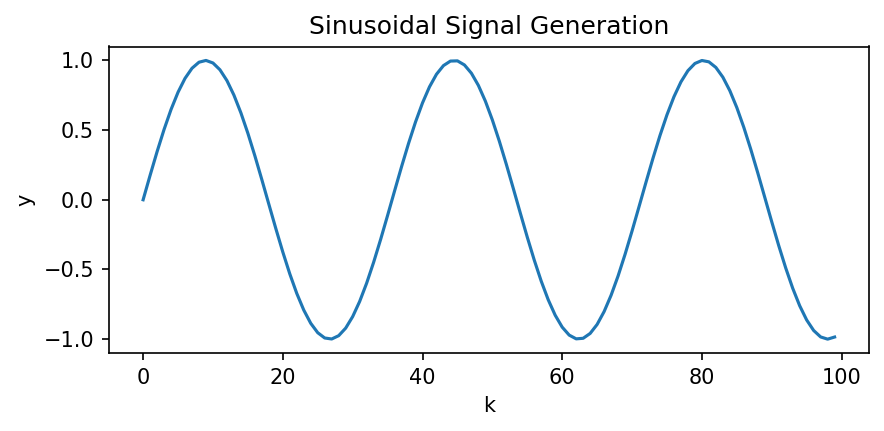
Generates multiple sinusoidal signals and adds them to one
Parameters:
-
K(int) –Signal length
-
k_periods(int or array_like of int) –signal periodicity in number of samples per period.
-
amplitudes(scalar, array_like of scalars, default:None) –amplitude(s) of a signal, if set to None all amplitudes are set to 1.0
-
k0s(int or array_like of int, default:None) –time index(es) of first zero-crossing of sinusoidal signal, if set to None all k0s are set to 1.0
Returns:
-
out(ndarray) –Sum of Sinusoidal signals of length K.
Example
Source code in lmlib/utils/generator.py
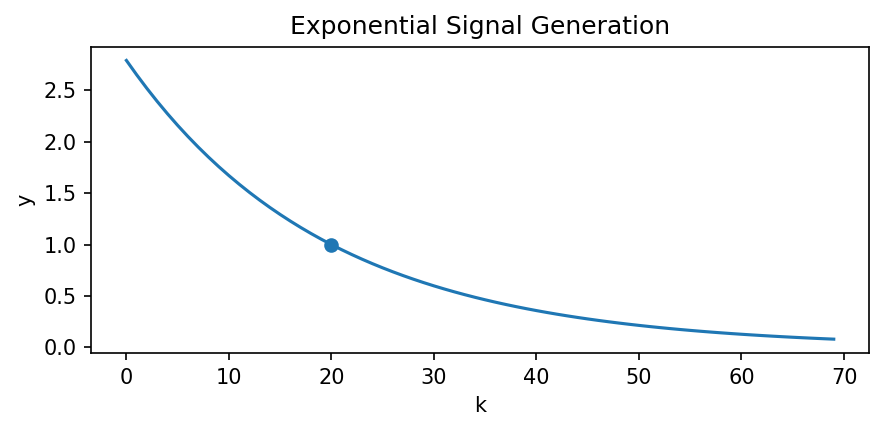
Exponentially decaying signal generator
\(y_k = \gamma^{k-k_0}\)
Parameters:
-
K(int) –Signal length
-
decay(float) –decay factor \(\gamma\)
-
k0(int, default:0) –index shift \(k_0\); it follows that \(y_{k_0} = 1\)
Returns:
-
out(ndarray) –Returns an exponential decaying signal of length K, normalized to 1 at index k0.
Example
Source code in lmlib/utils/generator.py
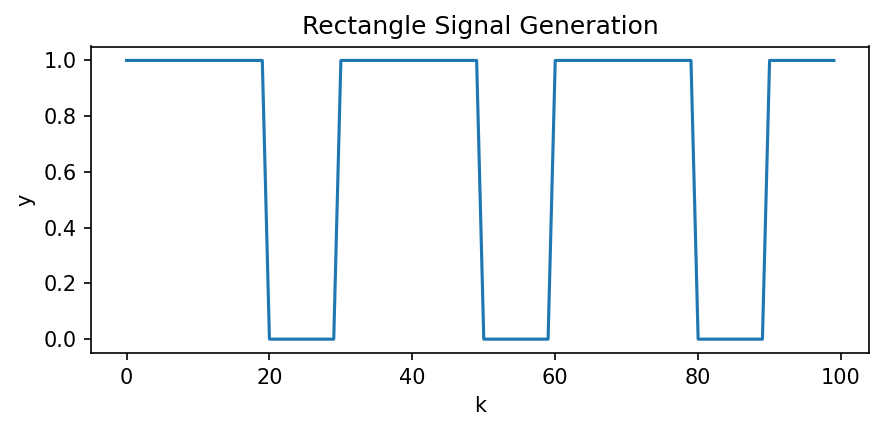
Rectangular (pulse wave) signal generator
Parameters:
-
K(int) –Signal length
-
k_period–periodicity, number of samples per period
-
k_on(int, default:None) –Number of samples of value 1, followed by k_period-k_on samples of value 0. Default is k_period//2 (only k_on or duty_cycle can be used)
-
duty_cycle(float, default:None) –Duty Cycle of a period (starts with 1). Default is k_period//2 (only k_on or duty_cycle can be used)
-
k0(int, default:0) –Start shift of a period, default k0=0
Returns:
-
out(ndarray, shape=(K,)) –Returns a rectangular wave signal of length
K.
Example
Source code in lmlib/utils/generator.py
Sawtooth signal generator
Parameters:
-
K(int) –Signal length
-
k_period–periodicity, number of samples per period
Returns:
-
out(ndarray, shape=(K,)) –Returns a repetitive slope signal of length K. Amplitudes are normalize from 0 to 1.
Source code in lmlib/utils/generator.py
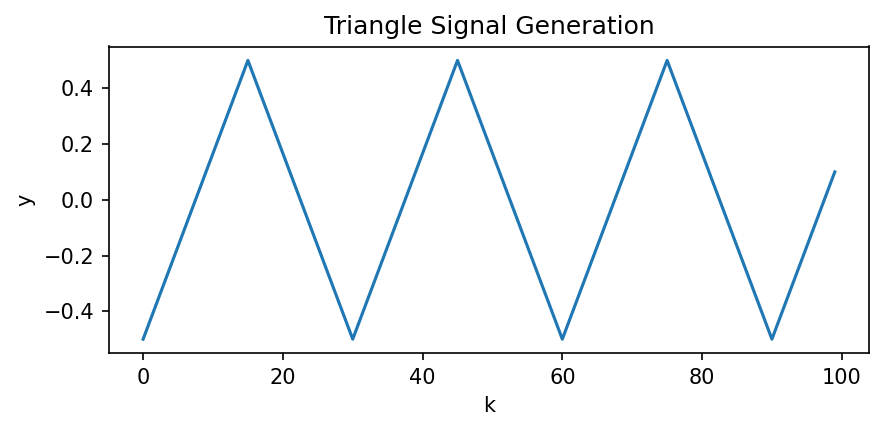
Triangular signal generator
Parameters:
-
K(int) –Signal length
-
k_period–periodicity, number of samples per period
Returns:
-
out(ndarray, shape=(K,)) –Returns a triangular signal of length K with k_period samples per triangle. Amplitudes aer normalize from 0 to 1.
Example
Source code in lmlib/utils/generator.py
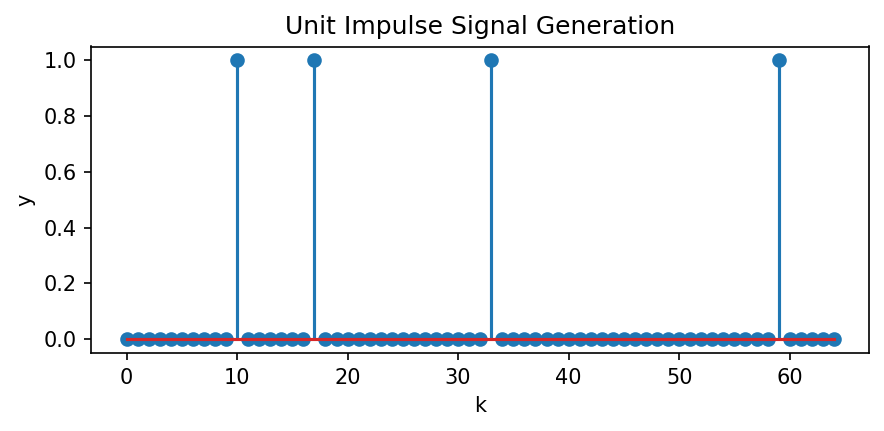
Pulse signal generator
Parameters:
Returns:
-
out(ndarray, shape=(K,)) –Returns a unit impulse signal trail of length K with values at indices ks set to 1, all others to 0.
Example
Source code in lmlib/utils/generator.py
Step signal generator
Parameters:
-
K(int) –Signal length
-
ks(list) –Amplitude step locations (indexes)
-
deltas(list) –Relative step amplitudes at indexes ks
Returns:
-
out(ndarray, shape=(K,)) –Returns a step signal of length K with steps of relative amplitudes deltas at indexes ks.
Example
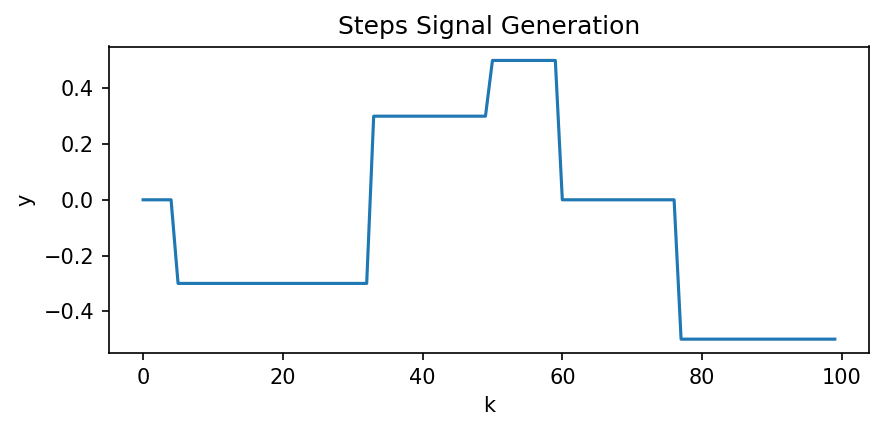
import matplotlib.pyplot as plt
from lmlib.utils.generator import *

K = 100
ks = [5, 33, 50, 60, 77]
deltas = [-0.3, 0.6, 0.2, -0.5, -0.5]
y = gen_steps(K, ks, deltas)

fig, ax = plt.subplots(figsize=(6, 3))
ax.set(xlabel='k', ylabel='y', title='Steps Signal Generation')
ax.plot(range(K), y)

plt.tight_layout()
plt.show()
Source code in lmlib/utils/generator.py
Slopes signal generator
Parameters:
-
K(int) –Signal length
-
ks(list) –Indices of slope change
-
deltas(list) –Slope start to end difference at each index in
ks
Returns:
-
out(ndarray, shape=(K,)) –Returns a signal of length
Kwith chances in slope by the valuesdeltasat indecesks.
Example
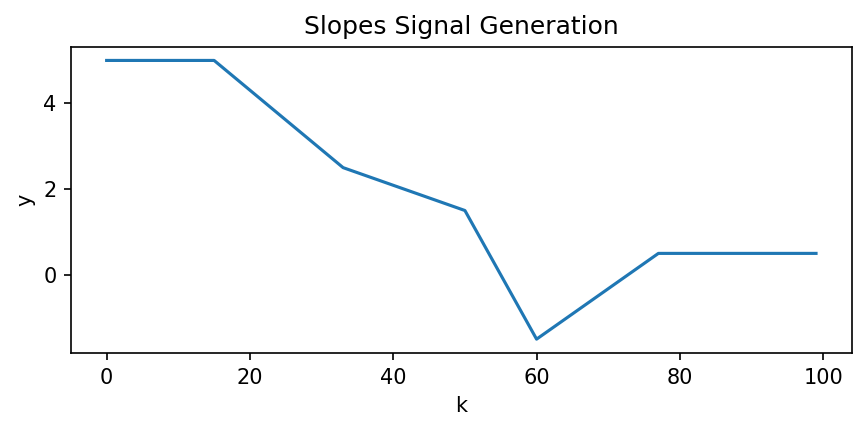
import matplotlib.pyplot as plt
from lmlib.utils.generator import *

K = 100
ks = [15, 33, 50, 60, 77]
deltas = [5, -2.5, -1, -3, 2]
y = gen_slopes(K, ks, deltas)

fig, ax = plt.subplots(figsize=(6, 3))
ax.set(xlabel='k', ylabel='y', title='Slopes Signal Generation')
ax.plot(range(K), y)

plt.tight_layout()
plt.show()
Source code in lmlib/utils/generator.py
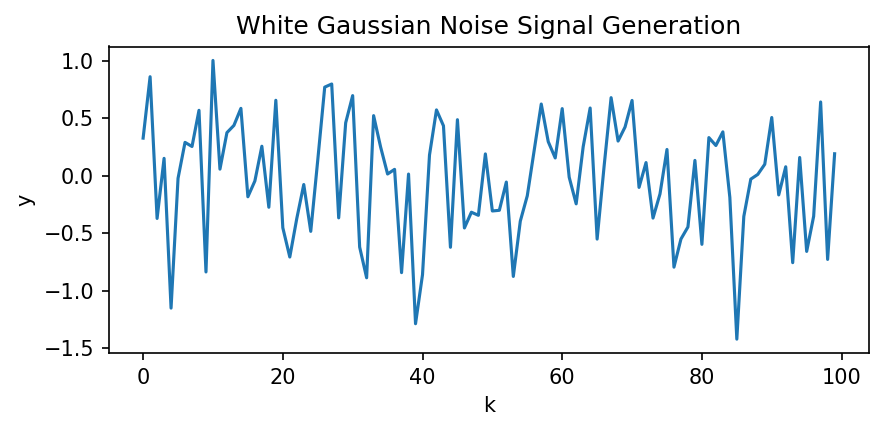
White Gaussian noise signal generator
Parameters:
-
size(int or tuple of ints) –Signal length when 'size' is integer. If 'size' is a tuple, the output shape corresponds to the tuple entries
-
sigma(float) –Sample variance
-
seed((int, None), default:None) –random number generator seed, default = None.
Returns:
-
out(ndarray) –Returns a white Gaussian noise signal of shape like
sizeand variancesigma.
Example
Source code in lmlib/utils/generator.py
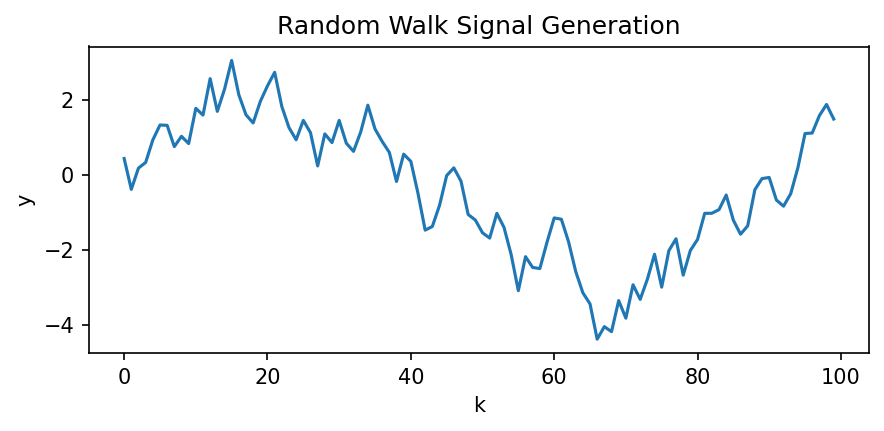
Random walk generator
Parameters:
-
size(int or tuple of ints) –Signal length when 'size' is integer. If 'size' is a tuple, the output shape corresponds to the tuple entries
-
seed((int, None), default:None) –random number generator seed, default = None.
Returns:
-
out(ndarray) –Returns a signal of shape
sizewith a random walk
Example
Source code in lmlib/utils/generator.py
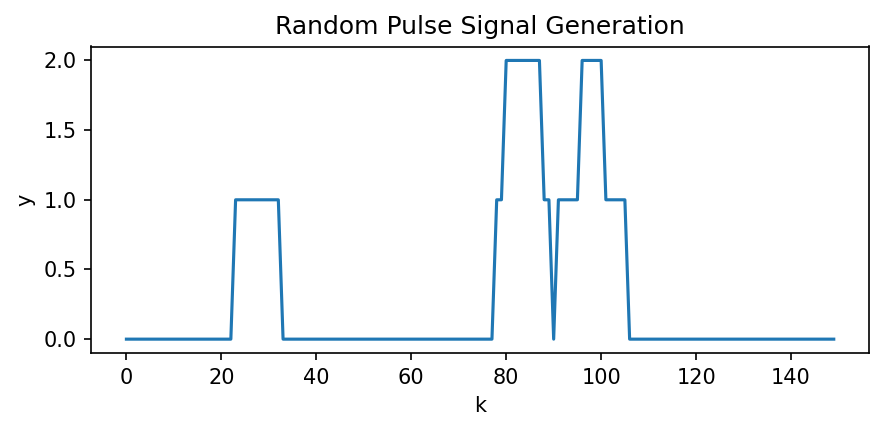
Random pulse signal generator
Parameters:
-
size(int or tuple of ints) –Signal length when 'size' is integer. If 'size' is a tuple, the output shape corresponds to the tuple entries
-
n_pulses(int) –Number of pulses in the per signal
-
length(int, default:1) –pulse length (number of samples per pulse set to
1) -
seed((int, None), default:None) –random number generator seed, default = None.
Returns:
-
out(ndarray) –Returns signal of shape
sizewith exactlyNunity pulses of lengthNat random positions per signal
Example
Source code in lmlib/utils/generator.py
Convolves two signals. The output signal shape (number of channels and signal length) is preserved from the base signal.
Parameters:
-
base(array_like) –Base signal to be convolved, either single- or multi-channel.
-
template(array_like) –Signal template to be convolved with
base, either a single- or multi-channel. Ifbaseis multi-channel, the number of channels has to correspond to the number of channels ofbase.
Returns:
-
out(ndarray, shape=(K,)) –If
templateis a single-channel signal, the convolution is applied to each channel ofbase, otherwise the convolution betweenbaseandtemplateis applied per-channel. The output signal is of the same dimension asbasesignal, cf.numpy.convolve(..., mode='same').
Example
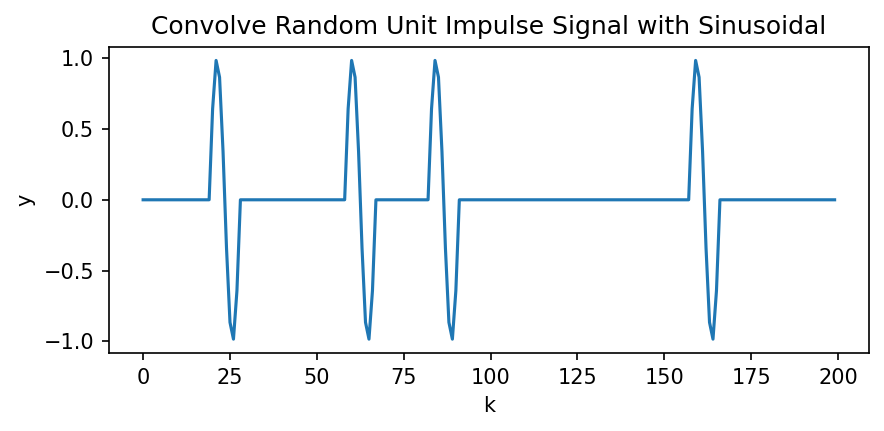
import matplotlib.pyplot as plt
from lmlib.utils.generator import *

K = 200
y_impulse = gen_rand_pulse(K, n_pulses=4)
y_template = gen_sine(K=10, k_periods=10)
y = gen_conv(y_impulse, y_template)

fig, ax = plt.subplots(figsize=(6, 3))
ax.set(xlabel='k', ylabel='y', title='Convolve Random Unit Impulse Signal with Sinusoidal')
ax.plot(range(K), y)

plt.tight_layout()
plt.show()
Source code in lmlib/utils/generator.py
Loads a single channel signal from the signal catalog, see biosignals_catalog.
Parameters:
-
name(str) –Signal name (from signal catalog)
-
K(int, default:-1) –Length of signal to be loaded. Default is
-1which loads to end of the file. IfKis larger than the maximal signal length, an assertion is raised. -
kstart(int, default:0) –Signal load start index. Default=0 If
kis larger than the maximal signal length, an assertion is raised. -
chIdx(int, default:0) –If the signal has multiple channels, chIdx selects the
chIdth channel in the signal Default: chIdx = 0
Returns:
-
out(ndarray, shape=(K,)) –Signal with shape=(K,)
Source code in lmlib/utils/generator.py
Loads a multi-channel signal from the signal catalog, see biosignals_catalog.
Parameters:
-
name(str) –Signal name (from signal catalog)
-
K(int, default:-1) –Length of signal to be loaded. Default is
-1which loads to end of the file. IfKis larger than the maximal signal length, an assertion is raised. -
kstart(int, default:0) –Signal load start index. Default=0 If
kis larger than the maximal signal length, an assertion is raised. -
chIdxs((None, array_like), default:None) –List of channels index to load. If is None then all channels will be loaded.
Returns:
-
out(ndarray, shape=(K, M)) –else shape=(K, M) for multichannel signals or uf
channelsis an array_like of lengthM
Note
If a file contains only one signal it will be loaded in a shape of a multi-channel signal (K, 1)
Source code in lmlib/utils/generator.py
loads csv data as a single-channel data shape
load_csv calls numpy.genfromtxt with a different interface.
Parameters:
-
file(str) –path to csv file (with '.csv' ending )
-
K(int, default:-1) –signal length, default loads whole data (K=-1)
-
k_start(int, default:0) –start of signal, default starts at k_start=0
-
channel(int, default:0) –load column of csv with the index specified by
channeldefault is 0 and loads the first column -
ds_rate(int, default:1) –down-sample rate (ds_rate >= 1)
-
kwargs(optional, default:{}) –keyword arguments passed to
numpy.genfromtxtto exclude header addskip_header=numbers_of_header_lines
Returns:
-
y(ndarray) –1 dimensional array of containing signal values over time
Source code in lmlib/utils/generator.py
loads csv data as a multi-channel data shape
load_csv_mc calls numpy.genfromtxt with a different interface.
Parameters:
-
file(str) –path to csv file (with '.csv' ending )
-
K(int, default:-1) –signal length, default loads whole data (K=-1)
-
k_start(int, default:0) –start of signal, default starts at k_start=0
-
channels((list, None), default:None) –load columns of csv with the index specified in
channelsdefault is None and loads all channels -
ds_rate(int, default:1) –down-sample rate (ds_rate >= 1)
-
kwargs(optional, default:{}) –keyword arguments passed to
numpy.genfromtxtto exclude header addskip_header=numbers_of_header_lines
Returns:
-
y(ndarray) –2-dimensional array, first is time dimensions, second, channels dimension
Source code in lmlib/utils/generator.py
loads a library-internal csv data file from the signal catalog as a single-channel data shape
See filenames as biosignals_catalog
load_lib_csv calls genfromtxt with a different interface.
Parameters:
-
filename(str) –filename (with '.csv' ending ) See biosignals_catalog.
-
K(int, default:-1) –signal length, default loads whole data (K=-1)
-
k_start(int, default:0) –start of signal, default starts at k_start=0
-
channel(int, default:0) –load column of csv with the index specified by
channeldefault is 0 and loads the first column -
ds_rate(int, default:1) –down-sample rate (ds_rate >= 1)
-
kwargs(optional, default:{}) –keyword arguments passed to
genfromtxtto exclude header addskip_header=numbers_of_header_lines
Returns:
-
y(ndarray) –1 dimensional array of containing signal values over time
Source code in lmlib/utils/generator.py
loads a library-internal csv data file from the signal catalog as a multi-channel data shape
See filenames as biosignals_catalog
load_csv_mc calls numpy.genfromtxt with a different interface.
Parameters:
-
filename(str) –filename (with '.csv' ending ) See biosignals_catalog.
-
K(int, default:-1) –signal length, default loads whole data (K=-1)
-
k_start(int, default:0) –start of signal, default starts at k_start=0
-
channels((list, None), default:None) –load columns of csv with the index specified in
channelsdefault is None and loads all channels -
ds_rate(int, default:1) –down-sample rate (ds_rate >= 1)
-
kwargs(optional, default:{}) –keyword arguments passed to
numpy.genfromtxtto exclude header addskip_header=numbers_of_header_lines
Returns:
-
y(ndarray) –2-dimensional array, first is time dimensions, second, channels dimension