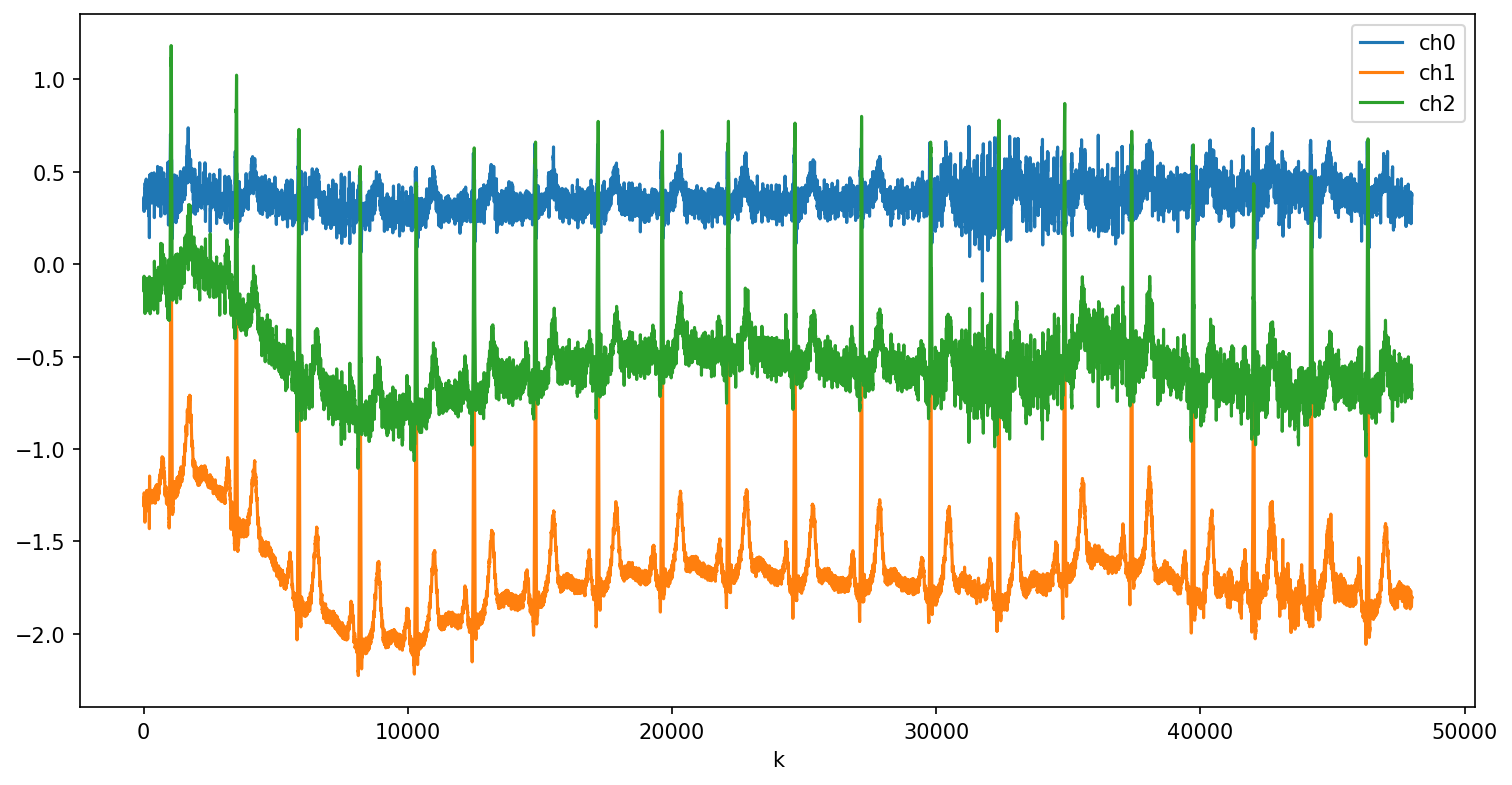
SECG3_RAW_3CH_20S_FS2400HZ.csv
- Surface ECG Signal (not filtered)
- 3 channel
- 20 seconds
- Sampling rate: 2400Hz
Plot
Code
"""
SECG3_RAW_3CH_20S_FS2400HZ.csv
==============================

- Surface ECG Signal (not filtered)
- 3 channel
- 20 seconds
- Sampling rate: 2400Hz

"""
from lmlib.utils import load_lib_csv_mc
import matplotlib.pyplot as plt

y = load_lib_csv_mc('SECG3_RAW_3CH_20S_FS2400HZ.csv')

plt.figure(figsize=(12, 6))
for m in range(3):
    plt.plot(y[:, m] + (2-m)*1.5, label=f'ch{m}')
plt.legend()
plt.xlabel('k')
plt.show()