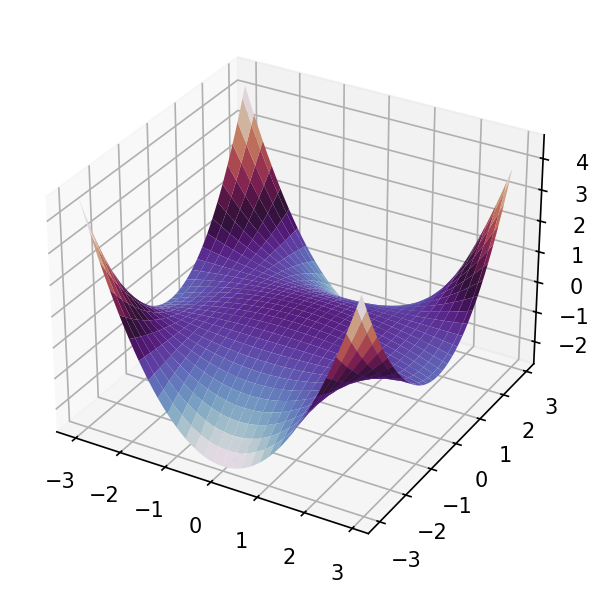
Surface Plot of Multivariate Polynomials [code202.0]
This guide script generates a bivariate polynomial using the MPoly class
and displays it as a 3-D surface plot.
Plot
Code
# -*- coding: utf-8 -*-
# Author: Waldmann Frédéric, Wildhaber Reto
"""
Surface Plot of Multivariate Polynomials [code202.0]
==================================================

This guide script generates a bivariate polynomial using the [`MPoly`][lmlib.polynomial.poly.MPoly] class
and displays it as a 3-D surface plot.

"""

# This import registers the 3D projection, but is otherwise unused.
from mpl_toolkits.mplot3d import Axes3D  # noqa: F401 unused import

import lmlib as lm
import matplotlib.pyplot as plt
import numpy as np

# creating a multivariate polynomial with two variables of order 2
mpoly = lm.MPoly(coefs=([0.1, -0.3, -0.1, 0.1],), expos=([0, 2], [0, 2]))

# defining the variables for evaluation
x = np.arange(-3, 3, 0.1)
y = np.arange(-3, 3, 0.1)
X, Y = np.meshgrid(x, y)

z = mpoly.eval((X, Y))

# create figure and an axes for a 3d plot
fig = plt.figure()
ax = fig.add_subplot(projection='3d')

# surface plot of the multivariate polynomial
ax.plot_surface(X, Y, z, cmap="twilight")
plt.show()