Text Recognition [ex801.0]
Demonstrates 2-D ALSSM-based text recognition using an
NDCompositeCost over a pixel image.
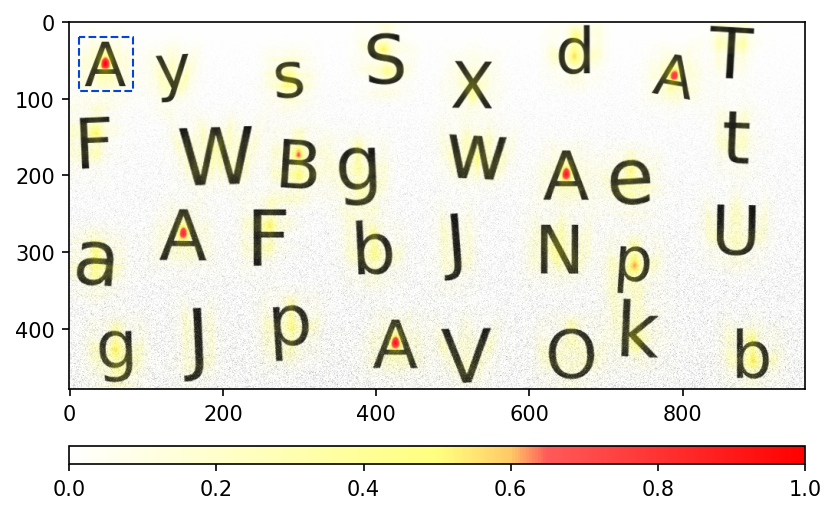
A reference letter image is used as a template. The 2-D ALSSM filter projects each local image patch onto a separable polynomial basis (one per image dimension) and computes the Log-Cost Ratio (LCR) between the best-fit model and a flat (constant) background model. Peaks in the resulting LCR map indicate the presence of the reference character.
Authors: Christof Baeriswyl, Frédéric Waldmann
Plot
Code
"""
Text Recognition [ex801.0]
--------------------------

Demonstrates 2-D ALSSM-based text recognition using an
[`NDCompositeCost`][lmlib.statespace.cost.NDCompositeCost] over a pixel image.

A reference letter image is used as a template.  The 2-D ALSSM filter
projects each local image patch onto a separable polynomial basis (one
per image dimension) and computes the Log-Cost Ratio (LCR) between the
best-fit model and a flat (constant) background model.  Peaks in the
resulting LCR map indicate the presence of the reference character.

Authors: Christof Baeriswyl, Frédéric Waldmann
"""
import numpy as np
import matplotlib.pyplot as plt
import lmlib as lm
import copy
import matplotlib
import os

try:
    SCRIPT_DIR = os.path.dirname(os.path.abspath(__file__))
except NameError:
    SCRIPT_DIR = os.getcwd()

npy_file_letters = os.path.join(SCRIPT_DIR, "image_letters.npy")
npy_file_letters_noise = os.path.join(SCRIPT_DIR, "image_letters_noise.npy")


def generate_letter_images():
    """Generate the clean and noisy synthetic letter images.

    Returns
    -------
    Y_nonoise : np.ndarray
        Clean image (normalized alpha channel of the rendered letter grid).
    Y : np.ndarray
        Noisy image (row-wise Gaussian noise added to ``Y_nonoise``).

    Notes
    -----
    Requires Pillow (PIL).  A fixed random seed is used so that the
    generated image (and therefore the reference position ``K1_REF`` /
    ``K2_REF`` below) is reproducible across runs.
    """
    from PIL import Image, ImageDraw, ImageFont
    import random

    # Fixed seeds -> reproducible image and reference position.
    random.seed(1)
    np.random.seed(1)

    # Pillow >= 9.1 moved resampling constants into Image.Resampling.
    try:
        RESAMPLE = Image.Resampling.BICUBIC
    except AttributeError:
        RESAMPLE = Image.BICUBIC

    alphabet = 'abcdefghijklmnopqrstuvwxyzABCDEFGHIJKLMNOPQRSTUVWXYZ'

    def load_font(size=80):
        """Load a usable TrueType font, trying common system paths."""
        candidates = [
            "/System/Library/Fonts/Courier.ttc",                       # macOS
            "/usr/share/fonts/truetype/dejavu/DejaVuSans.ttf",         # Debian/Ubuntu
            "/usr/share/fonts/truetype/liberation/LiberationMono-Regular.ttf",
            "C:\\Windows\\Fonts\\cour.ttf",                            # Windows
            "C:\\Windows\\Fonts\\arial.ttf",
        ]
        for path in candidates:
            try:
                return ImageFont.truetype(path, size, encoding="unic")
            except (OSError, IOError):
                continue
        # Fallback (note: the default bitmap font does not honor `size`).
        return ImageFont.load_default()

    # Create a reference / interferer image with a given letter
    def create_letter_image(letter):
        img = Image.new('RGBA', (100, 100), color=(255, 255, 255, 0))
        draw = ImageDraw.Draw(img)
        font = load_font(80)
        position = (10, 0)
        draw.text(position, letter, font=font, fill=(0, 0, 0, 255), align='center')
        return img

    # Create the synthetic image
    def create_synthetic_image_randomletters(grid_size=(8, 4), cell_size=(100, 100)):
        grid_image = Image.new(
            'RGBA',
            (grid_size[0] * cell_size[0], grid_size[1] * cell_size[1]),
            color=(255, 255, 255, 0),
        )
        # refletter = 'Z'
        refletter = 'A'
        for i in range(grid_size[0]):
            for j in range(grid_size[1]):
                # Randomly rotate and stretch the reference image
                angle = random.uniform(-5, 5)   # random rotation (deg)
                scale = random.uniform(1.0, 1.3)  # random scaling
                xpos = random.uniform(-30, 30)  # random position
                ypos = random.uniform(-30, 30)  # random position
                letter = random.choice(alphabet)

                if i == 0 and j == 0:
                    angle = 0
                    scale = 1
                    xpos = 0
                    ypos = 0  # fix for reference image
                    letter = refletter
                if (i == 5 and j == 1) or (i == 1 and j == 2) or (i == 3 and j == 3):
                    letter = refletter
                if i == 6 and j == 0:
                    letter = refletter
                    angle = -10
                    scale = 0.95  # 1.05

                image = create_letter_image(letter)
                transformed_image = image.rotate(angle, resample=RESAMPLE, expand=True)
                transformed_image = transformed_image.resize(
                    (int(transformed_image.width * scale), int(transformed_image.height * scale)),
                    RESAMPLE,
                )

                # Calculate position to paste the transformed image into the grid
                pos_x = int(xpos) + i * cell_size[0] + (cell_size[0] - transformed_image.width) // 2
                pos_y = int(ypos) + j * cell_size[1] + (cell_size[1] - transformed_image.height) // 2

                grid_image.alpha_composite(transformed_image, (pos_x, pos_y))

        return grid_image

    celllength = 120
    synthetic_image = create_synthetic_image_randomletters(cell_size=(celllength, celllength))
    Y_nonoise = np.array(synthetic_image)[:, :, 3] * 1.0
    Y_nonoise = Y_nonoise / np.nanmax(Y_nonoise)

    # Gaussian noise (row-wise): noise level increases with row index
    Y_image_gaussian = np.copy(Y_nonoise)
    rows, cols = Y_image_gaussian.shape[:2]
    for row in range(rows):
        std_dev = (row / rows) * 1.0 * 0.125
        noise = np.random.normal(0.0, std_dev, cols)
        Y_image_gaussian[row] = np.clip(Y_image_gaussian[row] + noise, 0, 1)
    Y = Y_image_gaussian.copy()

    return Y_nonoise, Y


# Generate the images on first run and cache them to disk; load them otherwise.
if os.path.exists(npy_file_letters) and os.path.exists(npy_file_letters_noise):
    Y_nonoise = np.load(npy_file_letters)
    Y = np.load(npy_file_letters_noise)
else:
    Y_nonoise, Y = generate_letter_images()
    np.save(npy_file_letters, Y_nonoise)
    np.save(npy_file_letters_noise, Y)

K1_REF = 55  # letter pixel position, x
K2_REF = 47  # letter pixel position, y

K1 = Y_nonoise.shape[0]
K2 = Y_nonoise.shape[1]
k1 = np.arange(K1)
k2 = np.arange(K2)

# ALSSM Definition
g = 100
l_side = 35
poly_degree = 3
alssm_poly_legendre_left = lm.AlssmPolyLegendre(poly_degree=poly_degree,a_seg=-l_side,b_seg=-1)
alssm_poly_legendre_right = lm.AlssmPolyLegendre(poly_degree=poly_degree,a_seg=0,b_seg=l_side)
segment_left = lm.Segment(a=-l_side, b=-1, direction=lm.FW, g=g)
segment_right = lm.Segment(a=0, b=l_side, direction=lm.BW, g=g)
F = [[1, 0],  # mixing matrix, turning on and off models per segment (1=on, 0=off)
     [0, 1]]

# filter signal
cost_d1 = lm.CompositeCost([alssm_poly_legendre_left, alssm_poly_legendre_right], [segment_left, segment_right], F)
cost_d2  = lm.CompositeCost([alssm_poly_legendre_left, alssm_poly_legendre_right], [segment_left, segment_right], F)
nd_cost = lm.NDCompositeCost([cost_d1, cost_d2])
nd_rls = lm.RLSAlssm(nd_cost, steady_state=True, backend='lfilter')
nd_rls.filter(Y)

xs_H1 = nd_rls.minimize_x()
xs_ref = xs_H1[K1_REF, K2_REF]  # store state variables as reference pulse shape
J_B = nd_rls.eval_errors(xs_H1)

N = nd_cost.get_alssm_order()

H_A = np.zeros((N, 1))
H_A[0, 0] = 1 #allow fitting of coefficient 0 (offset)

h_A = xs_ref.copy() #template
h_A[0] = 0 #set offset of template to 0 (will be estimated by minimize_x)
xs_H2 = nd_rls.minimize_x(H_A, h_A)
J_A = nd_rls.eval_errors(xs_H2)  # get SE (squared error) for hypothesis 1
cr = J_B / J_A

# ------------ Plotting -------------------------------
plot_costratio = True
if plot_costratio:
    # Convert grayscale image to RGB by stacking it three times along the last dimension
    image_rgb = np.stack([1 - Y] * 3, axis=-1)
    crdisplay = copy.copy(cr)
    crdisplayalpha = cr

    cvals = [0, 0.5, 0.60, 0.65, 1]
    colors = ["white", "yellow", "orange", "red", "red"]

    norm = plt.Normalize(min(cvals), max(cvals))
    tuples = list(zip(map(norm, cvals), colors))
    cmap = matplotlib.colors.LinearSegmentedColormap.from_list("", tuples)

    colored_overlay = cmap(crdisplay)
    colored_overlay_rgb = colored_overlay[...,
                          :3] * 1.0  # We only need the RGB channels, so discard the alpha channel for now

    alpha = crdisplayalpha[..., np.newaxis]
    alpha = alpha / np.nanmax(alpha)  # normalize to 1
    highlighted_image = (1 - alpha) * image_rgb + alpha * colored_overlay_rgb

    # Convert back to float for display
    highlighted_image = np.clip(highlighted_image, 0.0, 1.0)

    # Plot the original and highlighted images
    figsize = (7.8 * 0.7, 4.9 * 0.7)
    fig = plt.figure(layout='constrained', figsize=figsize, dpi=72)
    axs = fig.subplots(1, 1)
    cset = axs.imshow(highlighted_image)

    # Get the colormap colors
    alphas_fullrange = np.linspace(0, 1, num=cmap.N)  # sigmoid(np.linspace(0,1,num=cmap.N))
    alphas_fullrange = np.clip(alphas_fullrange, 0.5, 1)
    colors = cmap(np.arange(cmap.N))
    colors[:, -1] = alphas_fullrange
    cmap_with_alpha = matplotlib.colors.ListedColormap(colors)
    cmap_test = matplotlib.colors.ListedColormap(cmap(np.arange(cmap.N)))

    norm = plt.Normalize(0, 1)  # Set the normalization from -1 to 0
    fig.colorbar(matplotlib.cm.ScalarMappable(norm=norm, cmap=cmap_with_alpha), ax=axs, location='bottom', aspect=40)

    # plot reference area
    col_reference = 'xkcd:blue'
    k1boxmin = K2_REF - l_side
    k1boxmax = K2_REF + l_side
    k2boxmin = K1_REF - l_side
    k2boxmax = K1_REF + l_side
    axs.plot([k1boxmin, k1boxmin, k1boxmax, k1boxmax, k1boxmin], [k2boxmin, k2boxmax, k2boxmax, k2boxmin, k2boxmin],
             c=col_reference, lw=1, ls='--')
    plt.show()

plot_ref = True
if plot_ref:
    mappedtraj = lm.Trajectory.eval_y(nd_cost, xs_ref, (K1_REF,K2_REF), (K1,K2))

    width, height = 40, 40 # image cut-outsize

    figsize = (6.5, 4.8)
    fig = plt.figure(layout='constrained', figsize=figsize, dpi=72)
    ax = fig.add_subplot(121)
    cset = ax.imshow(Y, cmap='gray_r')
    csetlcr = ax.imshow(mappedtraj, cmap='hot', alpha=0.5)
    ax.axis((K2_REF - height, K2_REF + height, K1_REF + width, K1_REF - width))

    # 3D plot
    ax = fig.add_subplot(122, projection='3d')
    k1k1_, k2k2_ = np.meshgrid(range(K1_REF - width, K1_REF + width), range(K2_REF - height, K2_REF + height), indexing='ij')
    ax.plot_surface(k1k1_, k2k2_, Y[k1k1_, k2k2_], cmap='gray_r',alpha=0.6,zorder=1)

    ax.plot_surface(k1k1_, k2k2_, mappedtraj[k1k1_, k2k2_], cmap='plasma',alpha=0.7,zorder=3)
    ax.plot_wireframe(k1k1_, k2k2_, mappedtraj[k1k1_, k2k2_], colors='b',zorder=3)

    ax.set_xlabel("Y axis") #note the swapped axis
    ax.set_ylabel("X axis")
    ax.view_init(azim=-1, elev=46)  # Change azimuth (horizontal angle) and elevation (vertical angle)
    ax.set_zlabel("Intensity")